The Labor Market at a Glance: Key Takeaways From the 2-Year Unemployment Trend
A look at the latest U.S. Bureau of Labor Statistics (BLS) chart reveals the story of the American workforce from May 2024 through May 2026. While overall numbers point to stability, a closer look at demographics and historical events exposes critical vulnerabilities
The Real Challenge: Talent Shortage
Key Insights From the Data
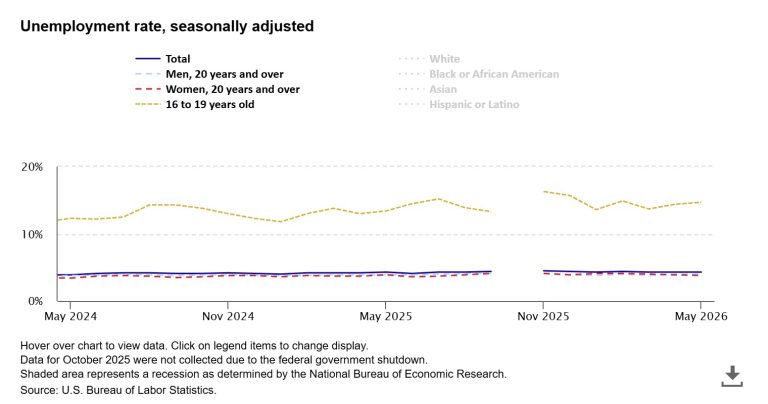
1. Teenage workers face the highest volatility. The unemployment rate for 16-to-19-year-olds remained stubbornly high, fluctuating between 12% and 16% over the two-year period.
2. Adult trends remain tightly bound. The unemployment rates for men and women aged 20 and over closely mirror each other, hovering consistently below 5%.
3. Overall national stability prevails. The total unemployment line showed little variance, maintaining a flat baseline across the 24-month span.
The October 2025 Data Blackout million unfilled roles over the next decade,
Government shutdown halted tracking. A distinct visual gap exists in the chart for October 2025.
Federal agencies paused collection. The BLS confirms that data for this month was entirely lost due to a federal government shutdown, disrupting economic forecasting.
What This Means Moving Forward
The persistent double-digit gap between teenage job seekers and adult professionals highlights an ongoing structural challenge in the labor market. While corporate hiring has kept adult unemployment steady, entry-level opportunities remain highly volatile and sensitive to seasonal shifts.
Sermavica LLC. has been providing staffing services and temporary employment opportunities, from business owners in search of employees, to candidates in search of employment.